Creating Charts on the "App Settings" Screen
If you are an app administrator, you can create charts on the "App Settings" screen and save them in the app. Once a chart is saved, it becomes available from the app's top page (the "View" screen) anytime, and it displays the latest data whenever it is accessed.
Up to 1,000 charts can be saved per app.
Creating a chart on the "App Settings" Screen
The following are the steps to create a chart on the "App Settings" screen.
-
Click the App Settings icon (the gear-shaped icon) at the upper right of the "View" screen.

-
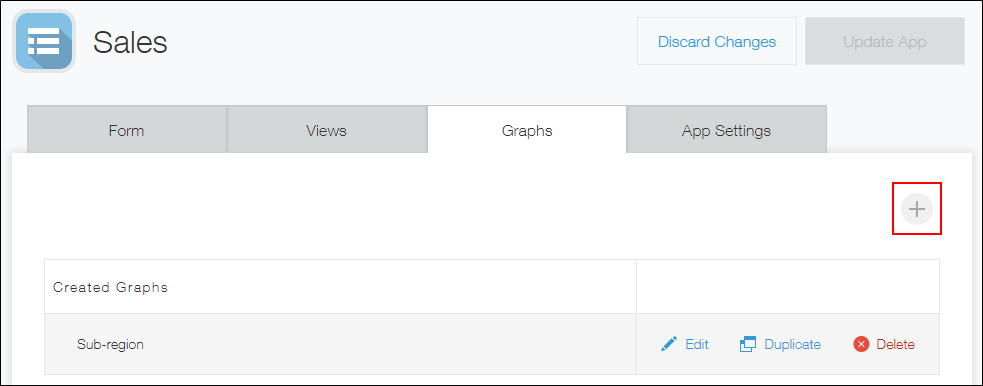
On the "App Settings" screen, click the Graphs tab.
-
Click the Create Graph icon (the plus sign-shaped icon at the right of the screen).
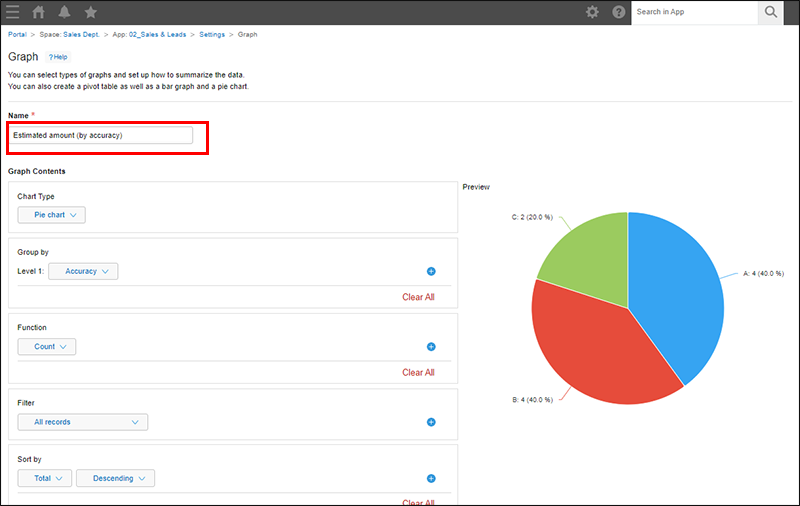
-
Enter a name for the chart.
-
Configure the items in the Graph Contents section.
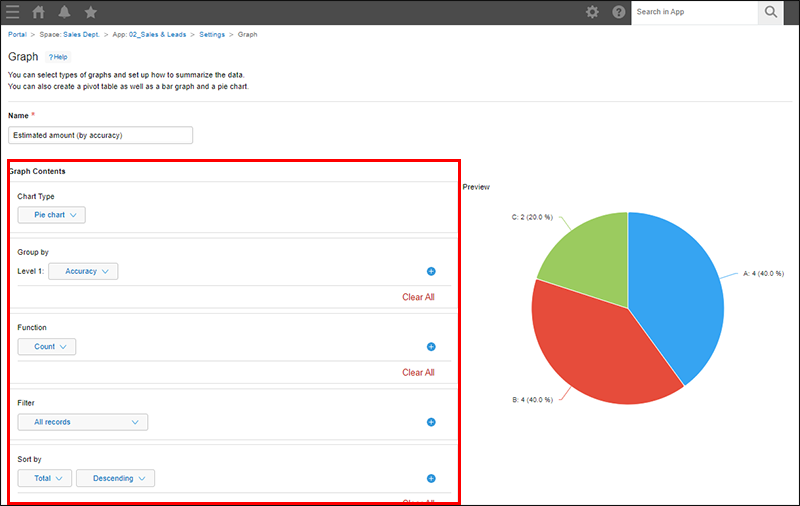
- Chart Type
Select how you want the aggregate result to be displayed.
Chart Types and Their Usage
If you are to select Pivot Table, refer to Restrictions applied when "Pivot Table" is selected. - Group by
If you want to apply grouping criteria for record data, configure the grouping here.
If you select a "Date" or "Time" field, you can group record data by month or day.
You can specify Level 1, Level 2, and/or Level 3. In the case of a column chart, the Level 1 item is displayed on the horizontal axis and the Level 2 item is used as data series.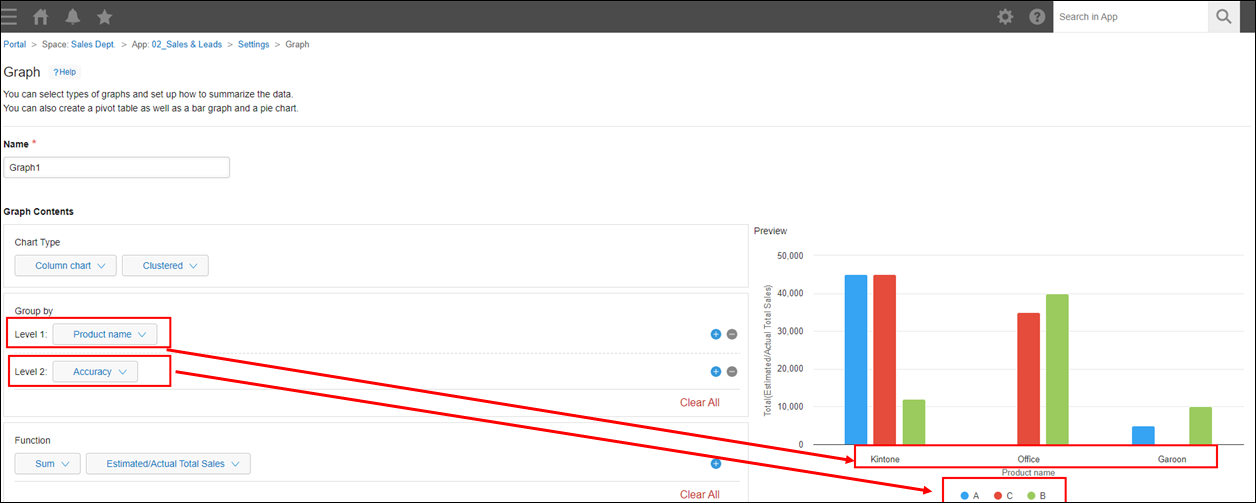
- Function
Specify how you want the data to be aggregated.
If you want to find the latest or the oldest records based on the values of a "Date and time" field, select Maximum or Minimum respectively.
How the Function setting is applied on the chart differs depending on the chart type. For example, in the case of a clustered column chart, the Function setting is applied to the vertical axis.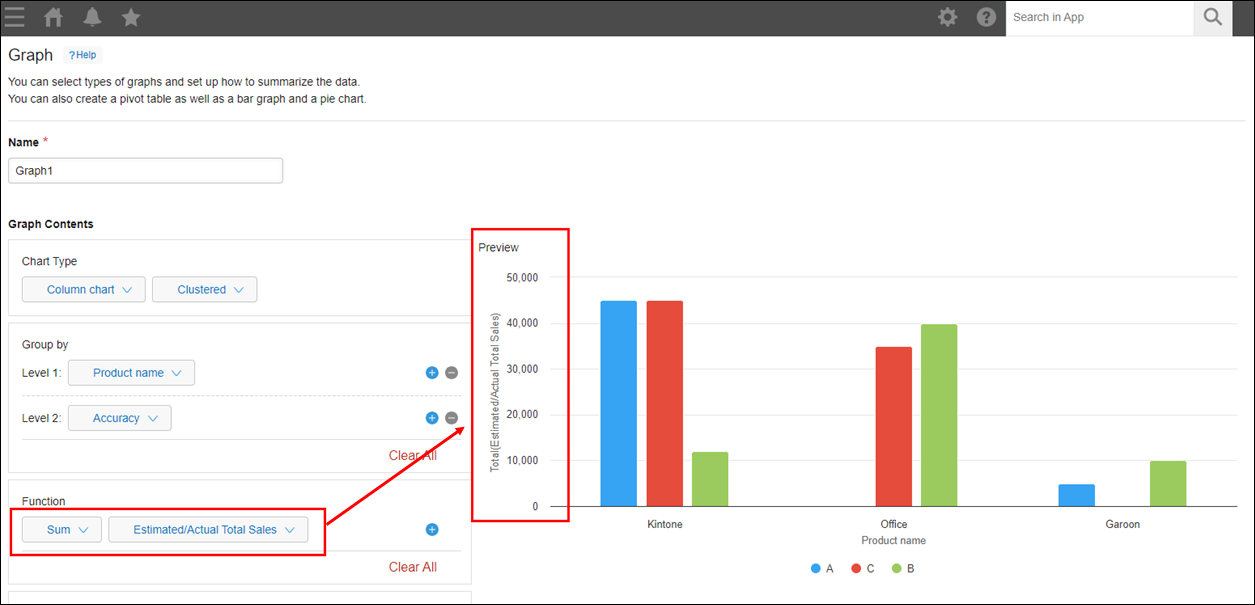
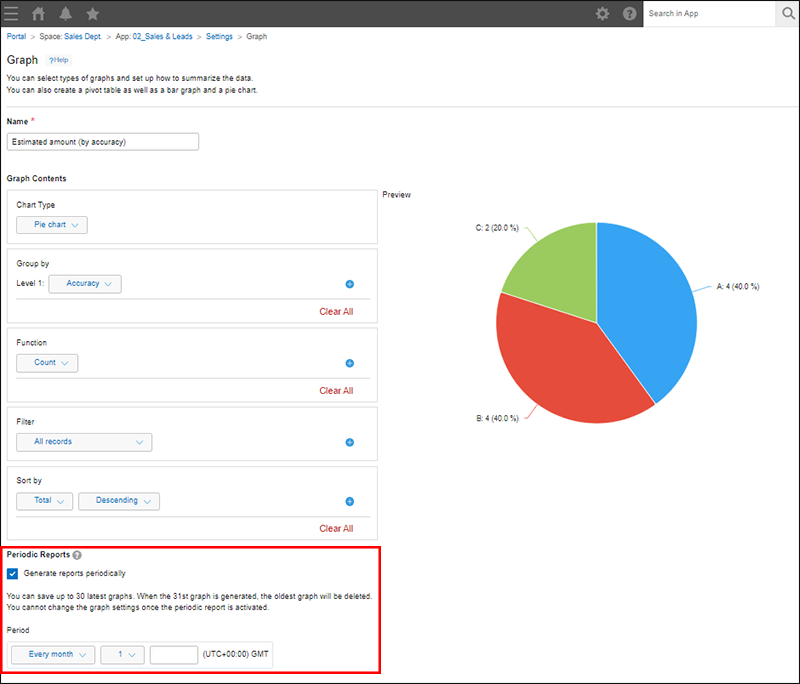
- Filter
If you want to limit the scope of data aggregation to certain records, set filter conditions here.
Notes on using "contains" or "does not contain"
The difference in the result of filtering when a department is specified as a filter condition for field values - Sort by
Select the sort order of the aggregate result.
If you select Level 1, Level 2, or Level 3, the aggregate result is sorted based on the values of the field set for the selected item.
- Chart Type
-
If you want to set up periodic reports, select the Generate reports periodically checkbox and specify the interval for generating reports.
-
Click Save at the bottom right of the screen.
-
Click Update App at the upper right of the screen.
-
On the confirmation dialog, click Update App.
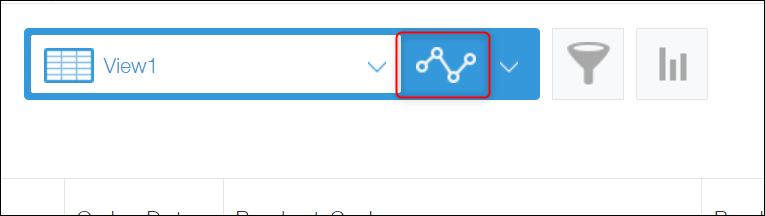
To display the created chart, click the chart button on the "View" screen.
Select a chart name.
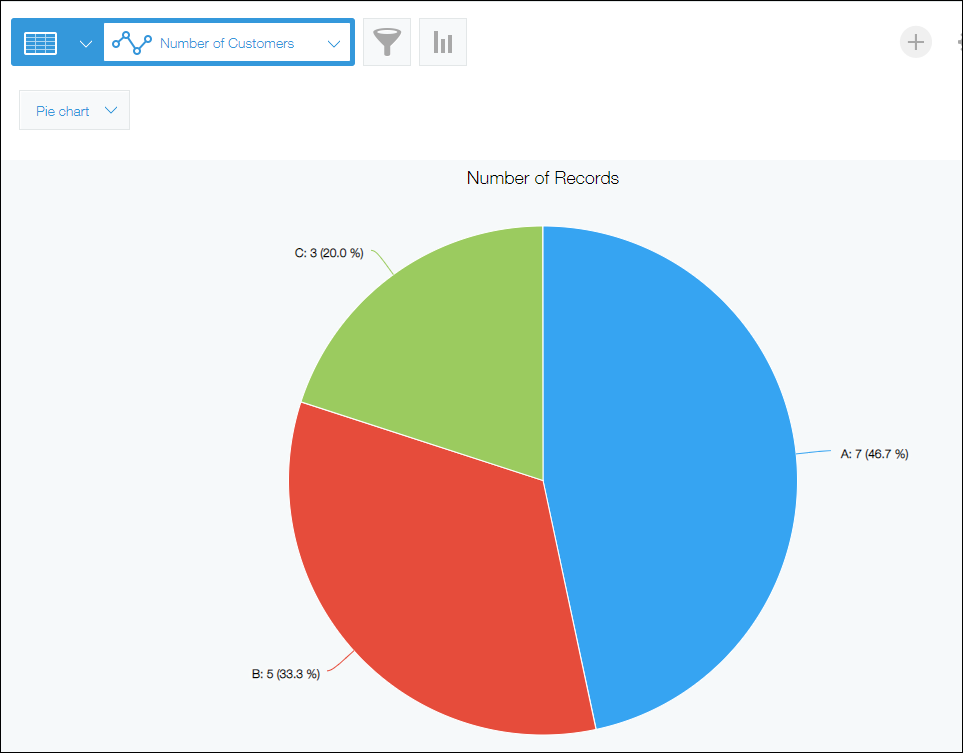
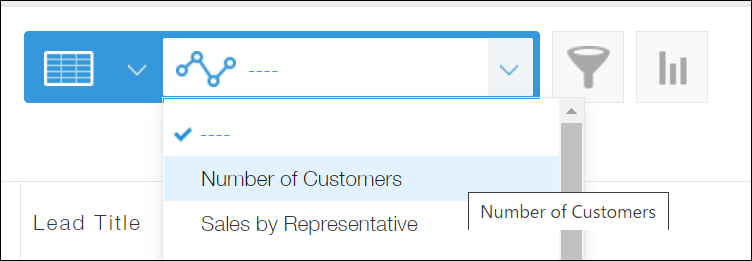 The chart is displayed.
Restrictions applied when "Pivot Table" is selected
If you select Pivot Table in the Chart Type section, note the following.
- The following restrictions apply to fields specified in the Group by section.
- Level 1:
The number of groups generated as a result of grouping field values must be 50 or less. - Level 2:
The number of groups generated as a result of grouping field values must be 1,000 or less.
- Level 1:
- If you want to perform data aggregation beyond the above limitations, export the aggregate result to an Excel workbook file and perform data aggregation on the file.
Exporting an Aggregate Result to a File
The following are the restrictions on exporting an aggregate result to a file:- Level 1:
The number of groups generated as a result of grouping field values must be 100 or less. - Level 2:
The number of groups generated as a result of grouping field values must be 10,000 or less.
- Level 1:
- Data can be sorted only by Level 1, Level 2, or Level 3. It is not possible to sort data by Total.
- It is not possible to set up periodic reports.