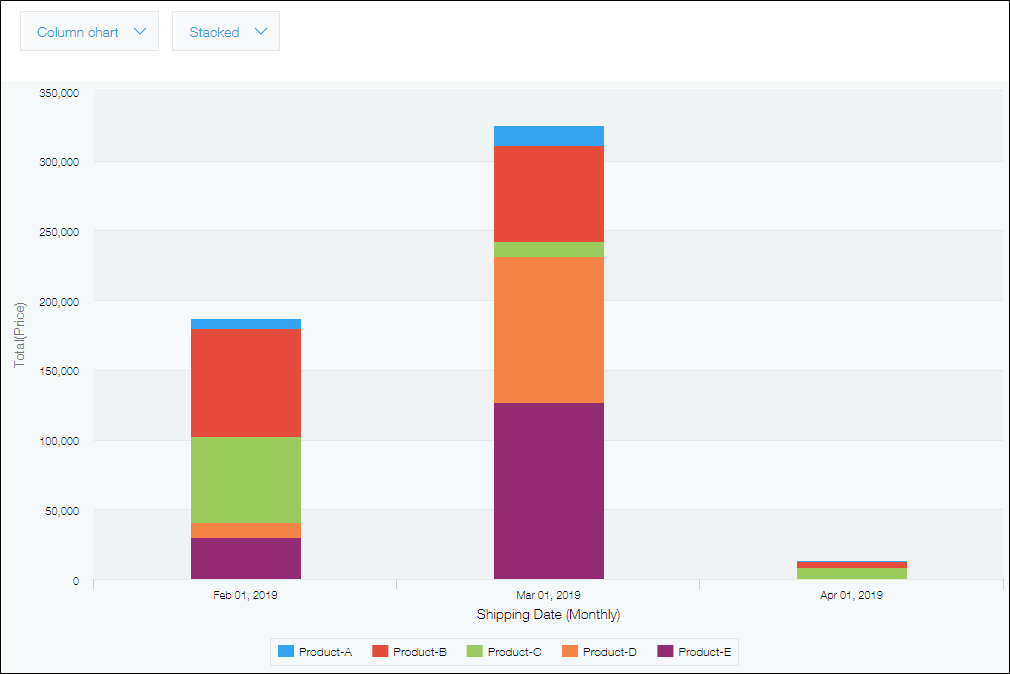
Overview of the Chart Feature
The Chart feature lets you aggregate an app's record data (e.g., data contained in records, numbers of records) and display the aggregated data in chart or table format.

Creating a chart
A chart can be created using either of the following methods.
- Create a chart from the App settings screen
You can create a chart by configuring data aggregation conditions on the App settings screen. To do so, you need permission to manage the relevant app.
Creating charts on the "App settings" screen - Create a chart from your app's View screen
You can aggregate an app's record data, including numeric values and numbers of records, and create a chart from the app's View screen. Permission to manage the app is not required.
Creating charts
Whichever way you choose, once you save your chart settings, you can display a chart with the latest data anytime from your app's main page (the View screen).
To save your chart settings, you need permission to manage the relevant app.
