The order of the data in a bar chart (clustered) is reversed
In a bar chart (clustered), the origin of the vertical axis is the bottom of the axis.
Therefore, if you perform a sort by Level 2 or Level 3, the items are displayed in ascending or descending order from the bottom of the vertical axis of the chart.
This article explains how to sort items in a bar chart (clustered) using examples.
Example of field settings
In your app, place the fields used to create a chart.
- Select the Form tab on the App settings screen, then place Text, Number, and Check box fields on the app form.
- In the Check box settings screen, add the following items under Options.
sample1
sample2
sample3
sample4
Save the form and update the app.
Example of adding records
Add the following records.
-
Text field: Type "test"
Number field: Type "1"
Check box field: Select sample1
-
Text field: Type "test"
Number field: Type "3"
Check box field: Select sample2
-
Text field: Type "test"
Number field: Type "1"
Check box field: Select sample3
-
Text field: Type "test"
Number field: Type "2"
Check box field: Select sample4
Example of a chart setting
On the View screen, click the Create graph icon to add a chart. You can add a chart from the Graphs tab on the App settings screen.
- Chart type: Bar chart/Clustered
- Group by: Level 1 "Text", Level 2 "Check box"
- Function: Sum/Number
- Sort by: Level 2/Ascending
In the Create graph screen, click Apply to create a graph as shown below.
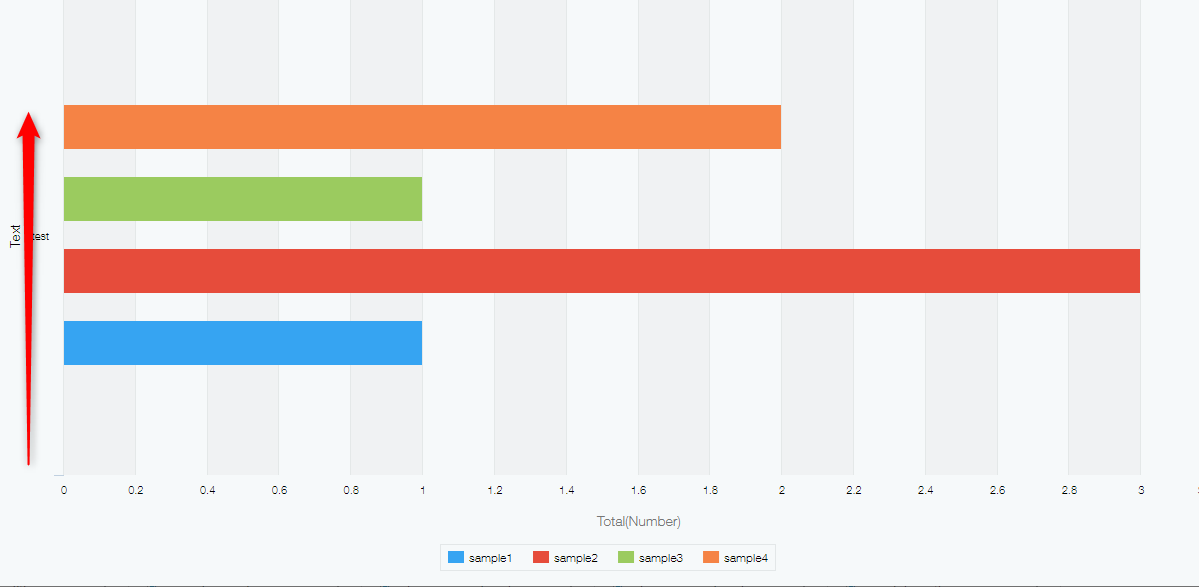
- The bottom of the vertical axis is set to the origin of the sort. Thus when you sort graph items "by Level 2 in Ascending order", items are displayed in the order from sample1 to sample4 (from the bottom to the top).
- The items in the legend is displayed from sample 1 to sample4 (from the left to the right) as you sort the graph items "by Level 2 in Ascending order".